




FABLS

Reports

What was planned.What actually went out.

The report starts with what was planned against what was published, per channel and per day. Then the top posts, the failures, and the numbers each platform reported — counted by FABLS, never typed in. It is a page in FABLS, and it downloads as CSV for whoever else needs to see it.

Reports in FABLS
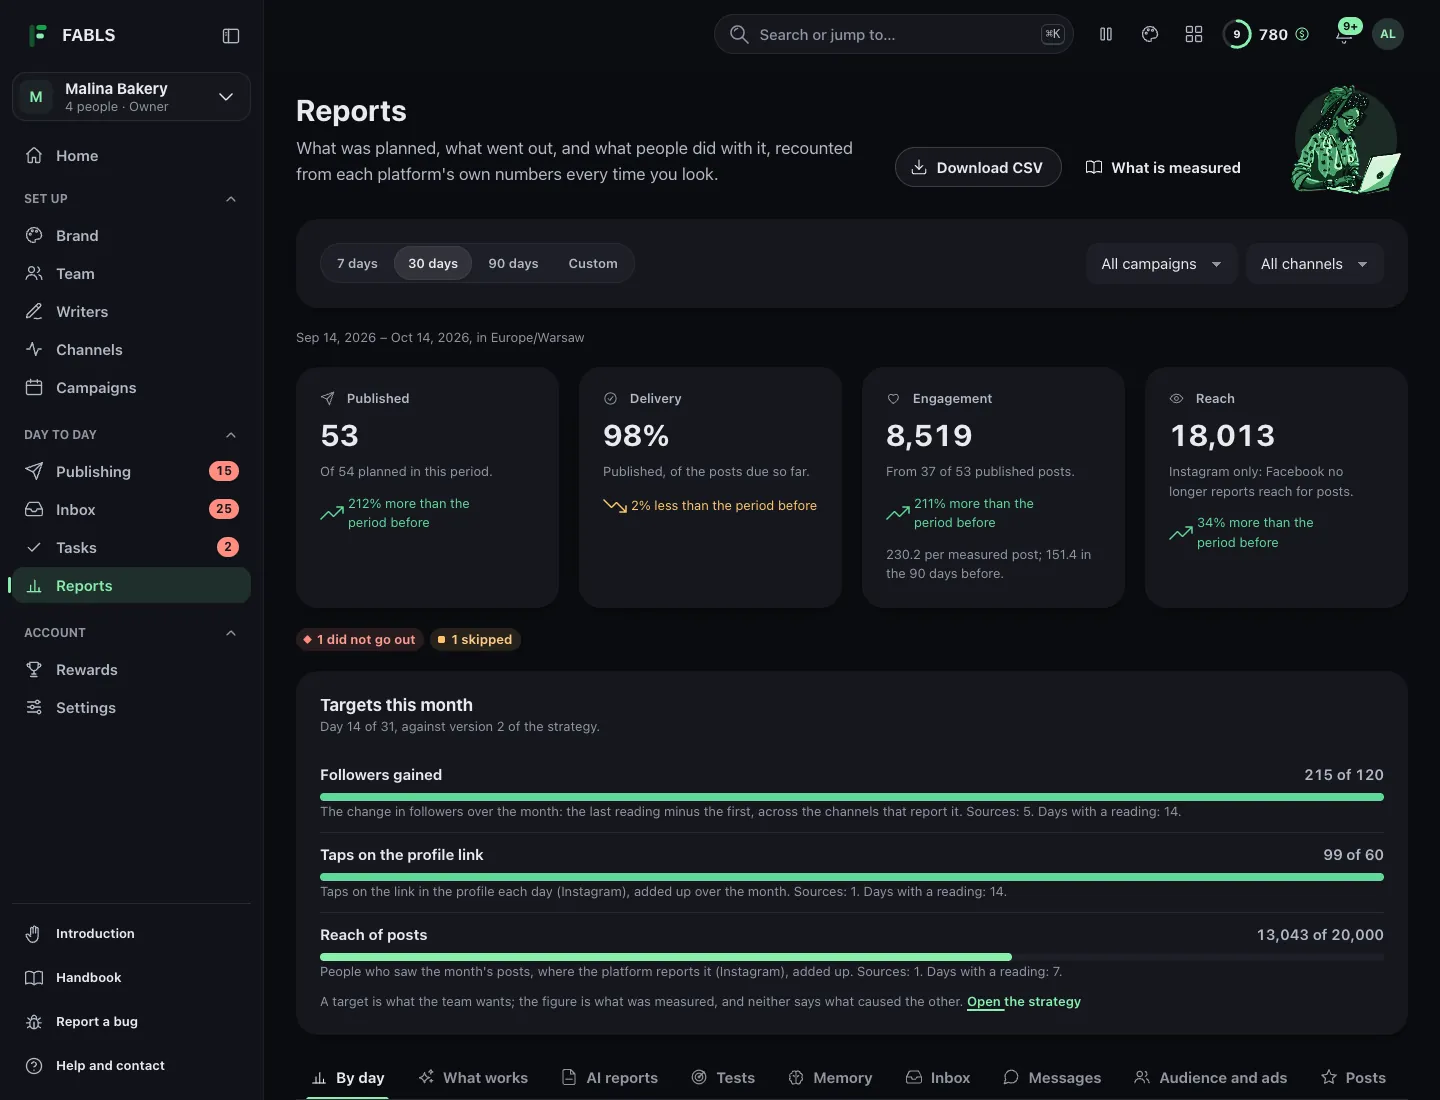
Demo: Reports: published, delivery, engagement and reach, against the last period. Malina Bakery is a made-up bakery; every screen here is the real app.

What the report actually says

It starts with the plan, not with numbers. Seventeen slots were planned; sixteen were published. That comparison — delivery — is the thing most reporting skips, and it is the only part that tells you whether the arrangement is working.

Then it goes by channel and by day: what appeared on the blog, on Facebook, on Instagram, on TikTok, on X, on LinkedIn, on Pinterest, on Threads, on YouTube and on Google, and when. Then the top posts and the failures, and the numbers each platform reported rather than anything typed in by hand.

Everything in it downloads as CSV, so the month can go into a spreadsheet, a client's folder or your own summary without anyone copying figures across.

Report · NovemberIllustration
  • 1Planned vs published17 planned · 16 published · 1 failed.
  • 2By channelBlog 4 · Facebook 6 · Instagram 6.
  • 3By dayWhat went out on each day of the month.
  • ·Top postsRanked by each platform's own numbers. Nothing typed in by hand.
  • 4FailuresOne Instagram post, in Instagram's own words.
  • 5CSVThe whole report, in one download.

Counted, not typedDownload as CSV

The honest bit: the report cannot tell you whether content is working after one month. Two or three months in, the planned-versus-published line will tell you something real about whether the arrangement is being kept up. Reception takes longer than anyone selling this category likes to admit.

Per platform

Each platform counts something different.
The report says which.

Facebook

Reactions and clicks for each post. Facebook does not report reach for posts, so the report shows none rather than a guess. The Page's own figures come day by day: followers, new and lost, engagements and Page views.

Instagram

Reach, likes, comments, saves and shares, and views for reels, then the account's reach, profile views and website clicks by day.

TikTok

Views, likes, comments and shares for each video FABLS posted, and the account's followers and likes by day.

X

The public numbers X gives for a post, and the account's followers by day. A number X does not give is shown as missing, never as zero.

LinkedIn

A company Page gives post numbers and comments, and both come into the report. A personal profile gives this kind of app none, so its posts count as published and no more.

Pinterest

The account's figures by day: followers, Pins, boards and monthly views. There are no numbers for single Pins.

Threads

Views, likes, replies and reposts for each post, and followers by day.

YouTube

Views, likes and comments for each video. A count YouTube hides is missing, never zero, and the channel's own figures are not read.

Google Business Profile

Local posts count as published. Reviews are counted in the inbox report, with the kind of item they are.

WordPress

Page views of each article, counted by the castomo plugin on your own site. WordPress gives nothing else back.

Ads are read from the ad platforms. Google Ads days are stored with their cost, and a boost's spend, impressions, reach and clicks are read from Meta for the days it served. Ads and boosts

Counted five times.
Never typed in.

An hour after it goes out,
then after 1, 3, 7 and 28 days.

Each platform's numbers for a post are collected an hour after it is published, then again after one, three, seven and 28 days, and the report is recomputed from them. A post that is still being found four weeks later shows it; so does a post that had its day in the first hour.

The report also compares. Each figure sits beside the period before it and beside your own last 90 days, and the inbox has a report of its own: volume, the median time to a first answer, the mood of comments over time, the mix of intents, how much autopilot answered, and the numbers per person. Learn goes further, with tests and the weekly and monthly AI reports.

Who reads it

More than one person needs this,
and they need different things.

The report is one page for everyone in the brand, and a CSV for everyone outside it. What each reader takes from it differs.

The person doing the work

Opens the publishing queue as well as the report: what is waiting for approval, what is going out, what didn't go out and why, in the platform's own words. Nothing is smoothed over, because smoothing it over is how a small problem becomes a quarterly one.

The client

Gets the CSV, or the weekly or monthly AI report, which FABLS mails to anyone who asks for it: planned against published, the channel breakdown and the top posts. Nobody has to assemble it on the last Friday of the month.

Whoever signs the invoice

Often a different person entirely, and often the one who has never seen any of the posts. The report's first line — planned against published — usually answers the one question they have: what did the retainer buy this month.

How agencies use this

Where the numbers come from

Reception is read from each platform's own figures. Nothing in a report is a number somebody typed, and nothing is an estimate presented as a measurement. Where a platform gives no figure, the report says so rather than filling the gap.

This is duller than a dashboard full of invented indices, and it is the only version that survives a client asking where a number came from.

Channels Learn

Illustrations by GetIllustrations.com (Hipster pack).